Statistical Information
In the United States, there are 35 states out of 50 where the death penalty is legal. It is estimated that there is about 1,348 executions per year. With the estimated number of executions it is estimated that 85% of the counties that allow the death penalty have not had any executions for 45 years, meaning that a lot of the executions happened in the same places.
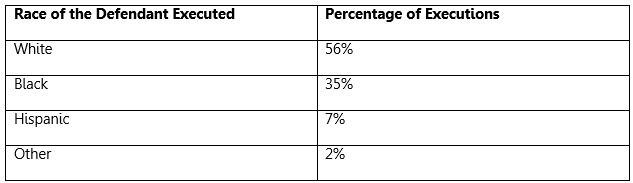
Capital crimes are at the expense of many different types of people, and many different types of people have been sentenced to death for committing them. The following table gives insight on the different races of people sentenced to death.
Capital crimes are at the expense of many different types of people, and many different types of people have been sentenced to death for committing them. The following table gives insight on the different races of people sentenced to death.
The victims in a capital crime are also of many different racial backgrounds. The following table gives insight on the races of the victims in various cases where capital punishment is administered.

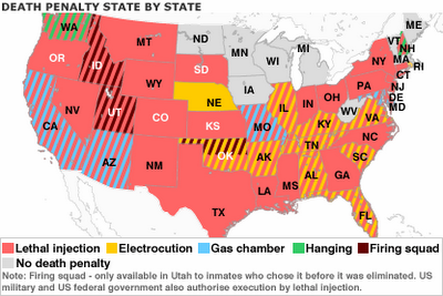
The following map has the methods of execution clearly displayed throughout the United States. It is clear that the lethal injection is the most used method, but electrocution and gas chambers are also used (though not nearly as much).
(Retrieved May 23, 2014, from http://filipspagnoli.wordpress.com/stats-on-human-rights/statistics-on-capital-punishment/)
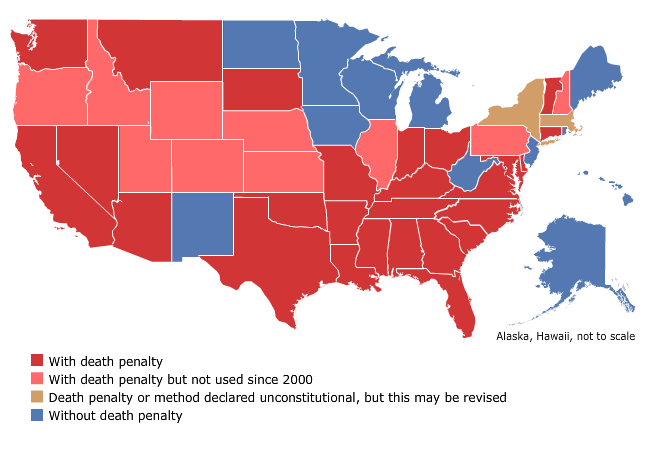
The map below displays the use of the death penalty throughout the United States. There are many states that have the death penalty legalized, some that have it legalized but have not used is in a long time, and others that have banned it completely.
(Retrieved May 23, 2014, from http://filipspagnoli.wordpress.com/stats-on-human-rights/statistics-on-capital-punishment/)
