Equation
The equation below represents the number of death penalty sentences compared to the number of actual executions resulting from that.
y=13/1000x or y= .013x
The equation is not the exact comparison, but from it you can get the average number of executions from the average number of members on death row per year. The equation is based on averages comparing around 3,136 inmates on death row to around 42 executions per year.
The y in the equation (dependent variable) represents the number of actual executions.
The x in the equation (independent variable) represents the number of death sentences given.
The 13/1000 or .013in the equation (the coefficient of x) represents the fact that approximately thirteen out of one thousand execution sentences are actually fulfilled.
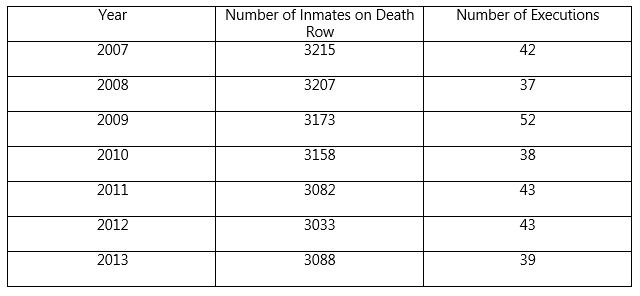
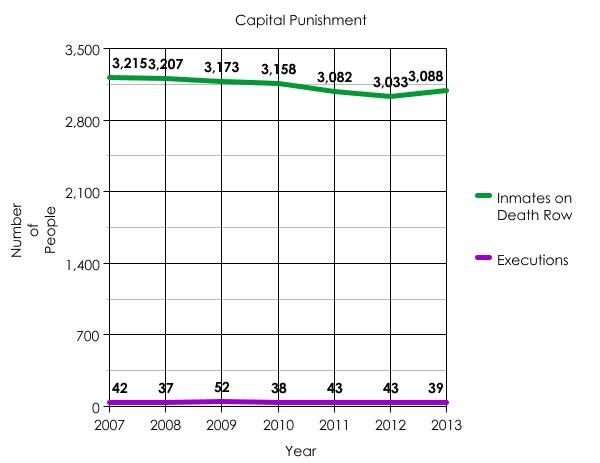
The graph and table below represent the difference between the number of inmates on death row and the number of executions from the years 2007 to 2013.
y=13/1000x or y= .013x
The equation is not the exact comparison, but from it you can get the average number of executions from the average number of members on death row per year. The equation is based on averages comparing around 3,136 inmates on death row to around 42 executions per year.
The y in the equation (dependent variable) represents the number of actual executions.
The x in the equation (independent variable) represents the number of death sentences given.
The 13/1000 or .013in the equation (the coefficient of x) represents the fact that approximately thirteen out of one thousand execution sentences are actually fulfilled.
The graph and table below represent the difference between the number of inmates on death row and the number of executions from the years 2007 to 2013.
Graph
Table